Browse, Query, Chart.
A desktop app for exploring production databases. Map the schema and query a sample. Pivot it, chart it. Then export the whole thing as an interactive report.
Signed macOS installer coming soon · Apache-2.0 · Unapologetically not Excel
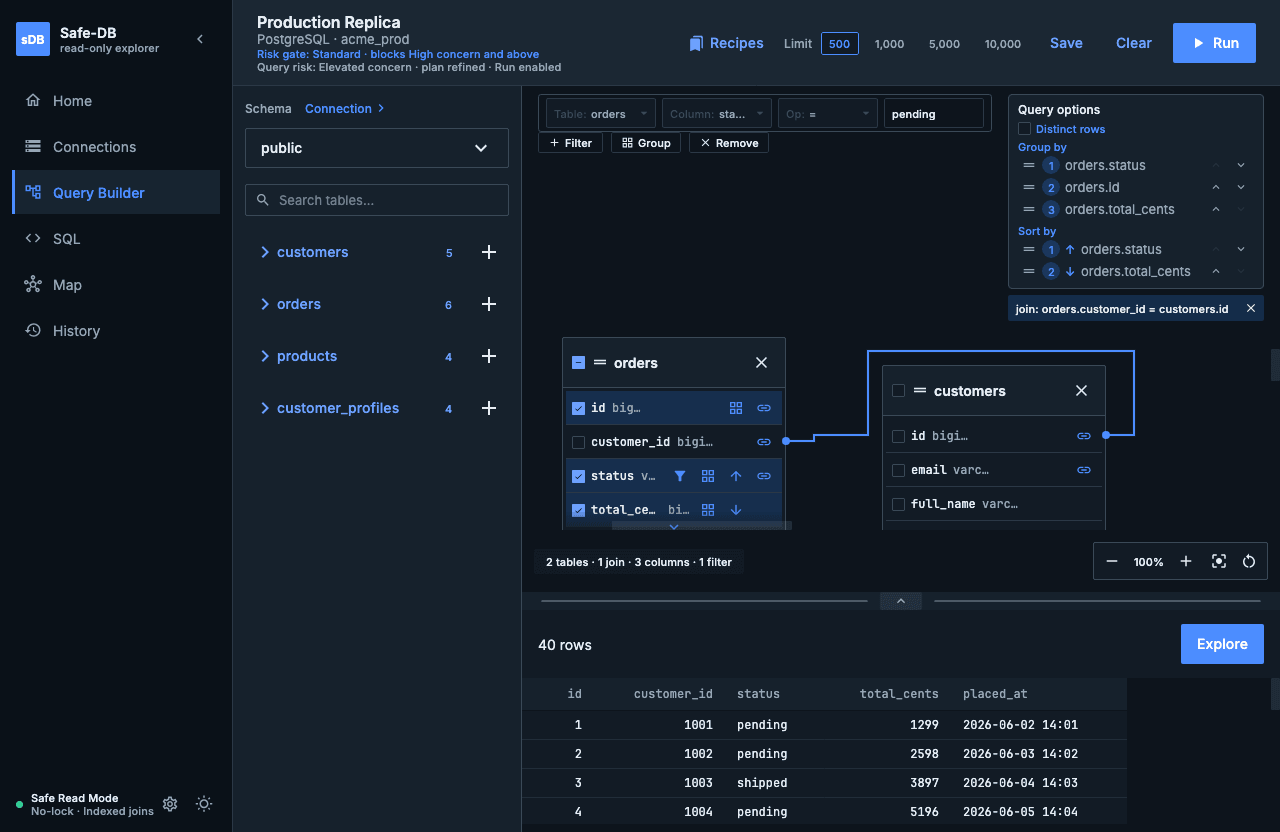
Drag, drop, connect. Build complex queries without the SQL.
See what you’re querying
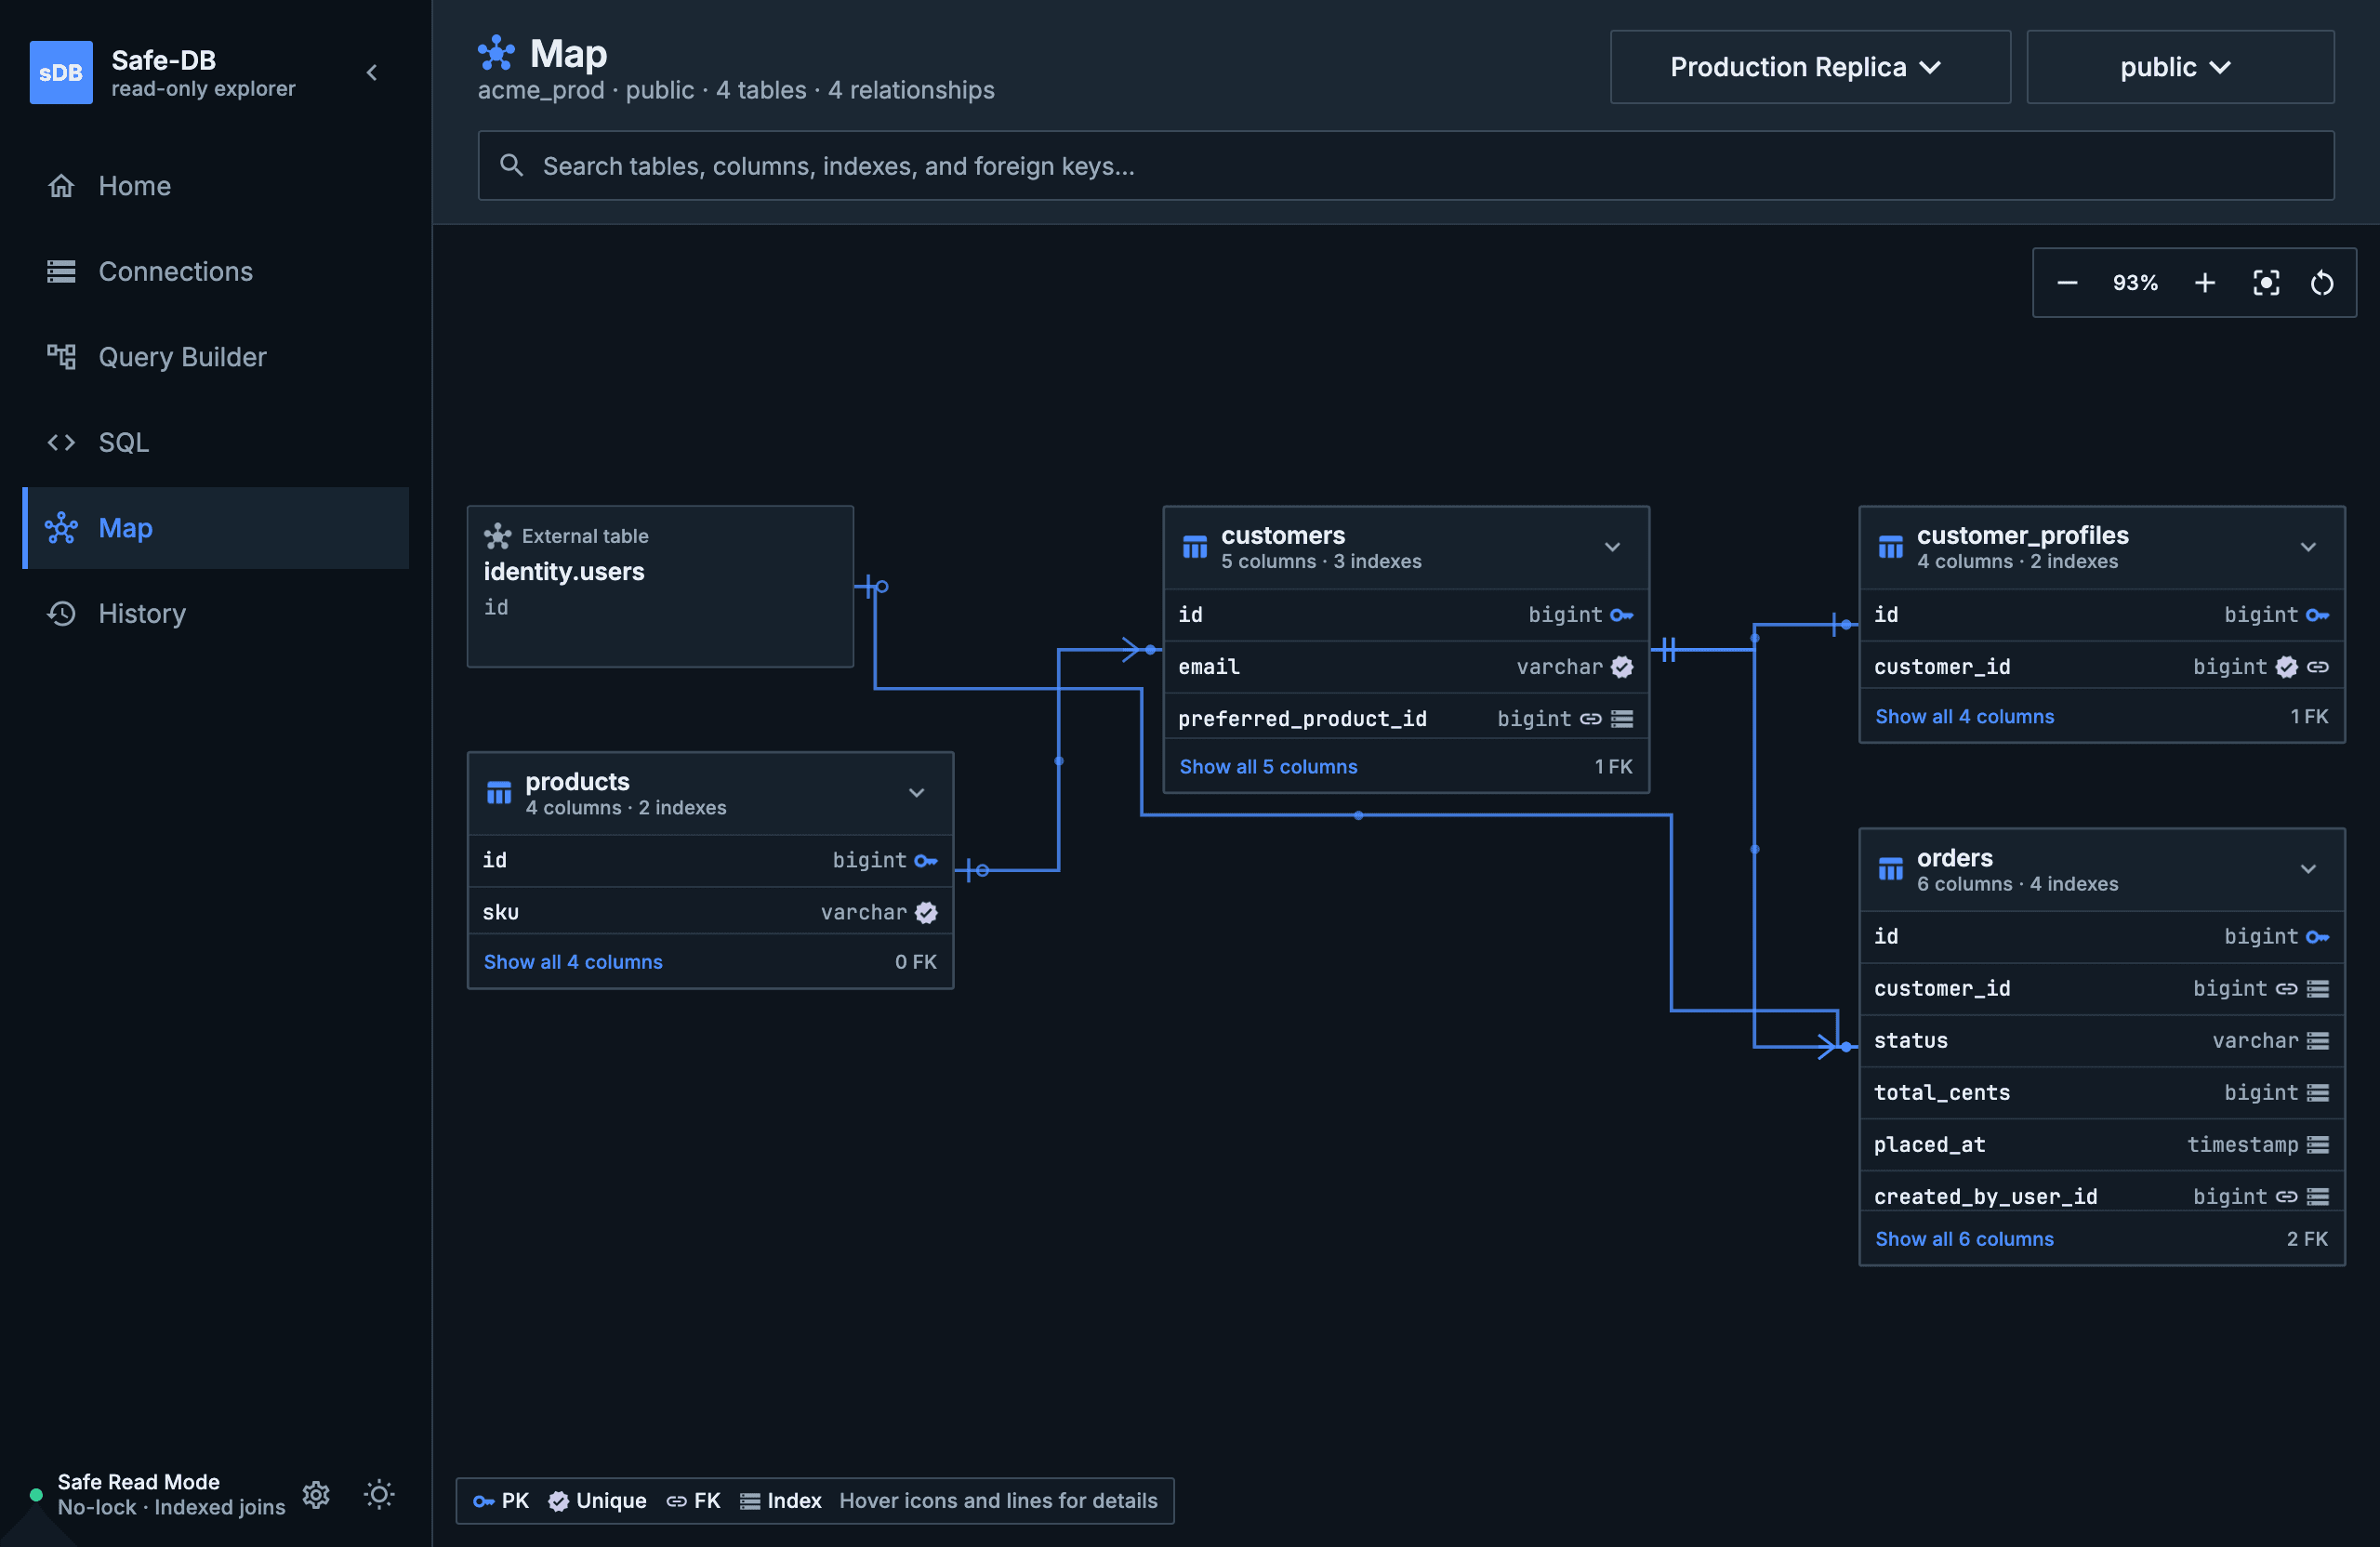
The schema map lays out tables, keys, indexes, and referenced external tables, so you can see how the data fits together before you ask it anything. Most SQL clients assume you have the schema memorized. safe-db draws you a map.
Queries are validated against the loaded schema and compiled with bound parameters, so what runs is exactly what you built, aimed at columns that actually exist.
SQL, within reason
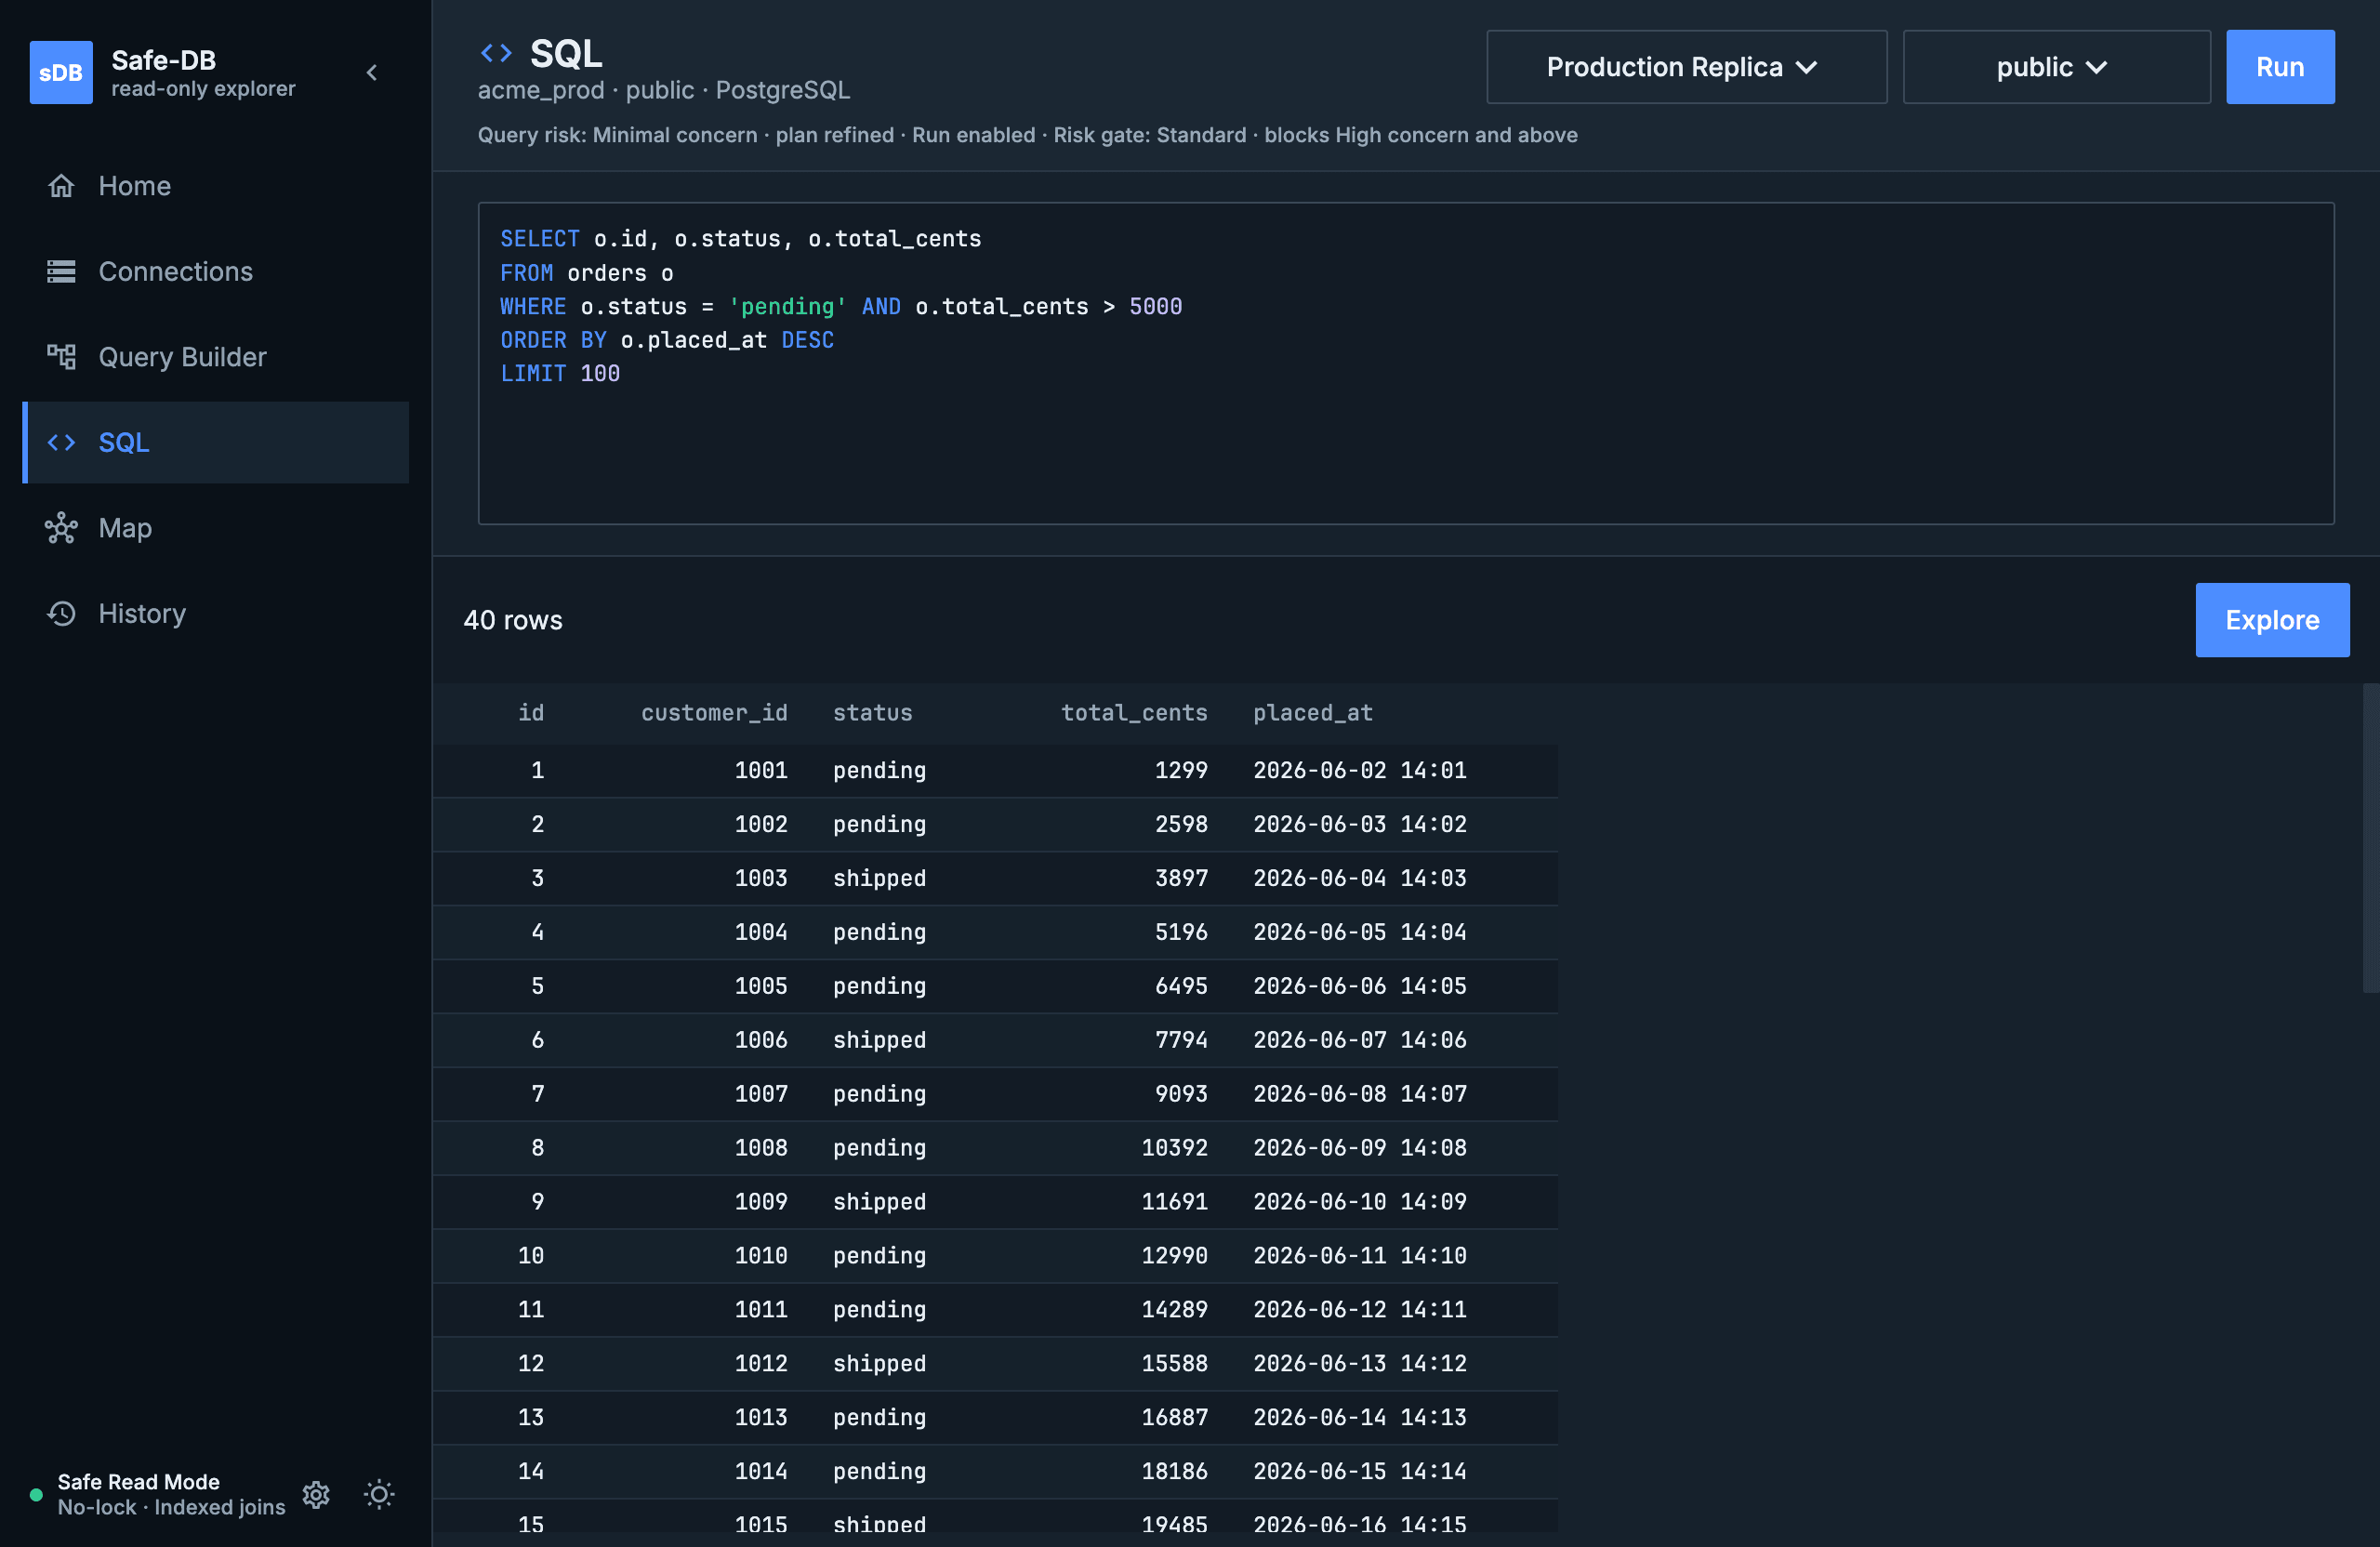
The SQL screen takes a single SELECT in your database’s dialect, with schema-aware autocomplete. It’s parsed into the same structured,
parameter-bound query the builder produces. Your text never reaches the database. Writes, subqueries,
and aggregates are rejected with an explanation.
Bounded by default
“Download everything” is not a feature. Every run is scored against an adjustable risk profile. A missing plan or a missing optimizer cost needs an explicit confirmed retry.
- Default sample
- 500 rows. Enough to answer the question.
- Hard cap
- 10,000 rows. The ceiling is not negotiable from inside the app.
- Query timeout
- 10 seconds, then the database is left in peace.
- Advisory
- A nudge above 1,000 rows, in case the question got ambitious.
Explore the sample, not the server
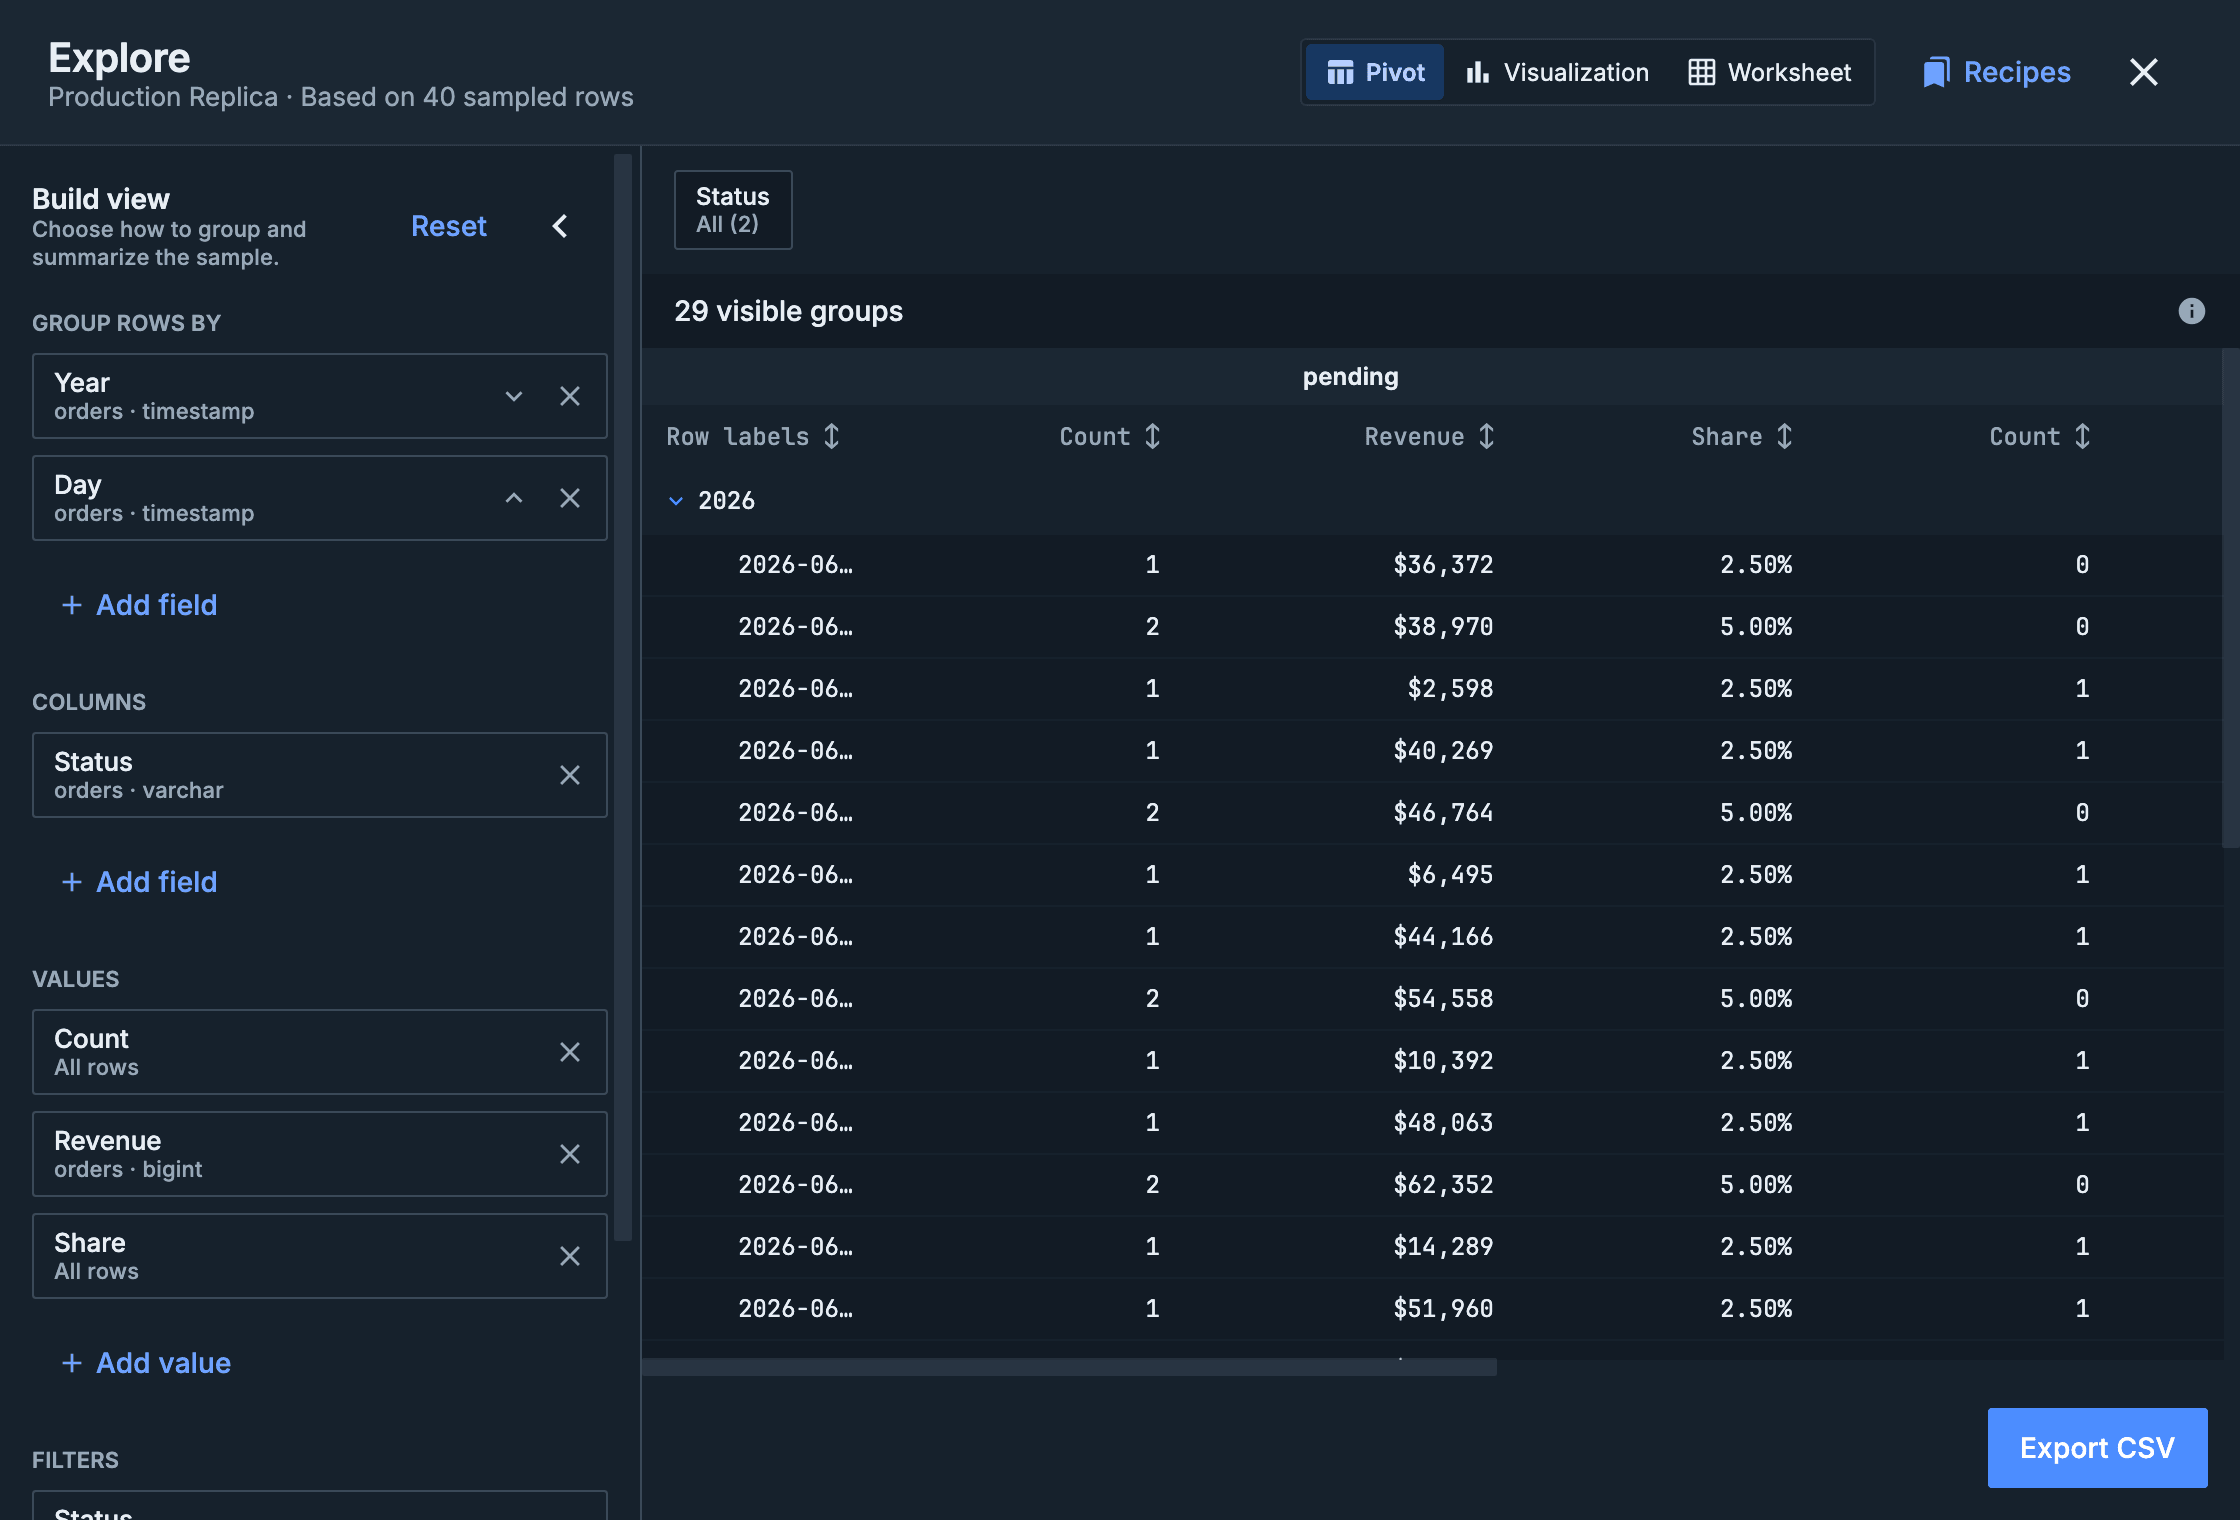
Pivot, Worksheet, and Visualization all work from an immutable sample. Tinker with the view as long as you like. Then export it to CSV or HTML.
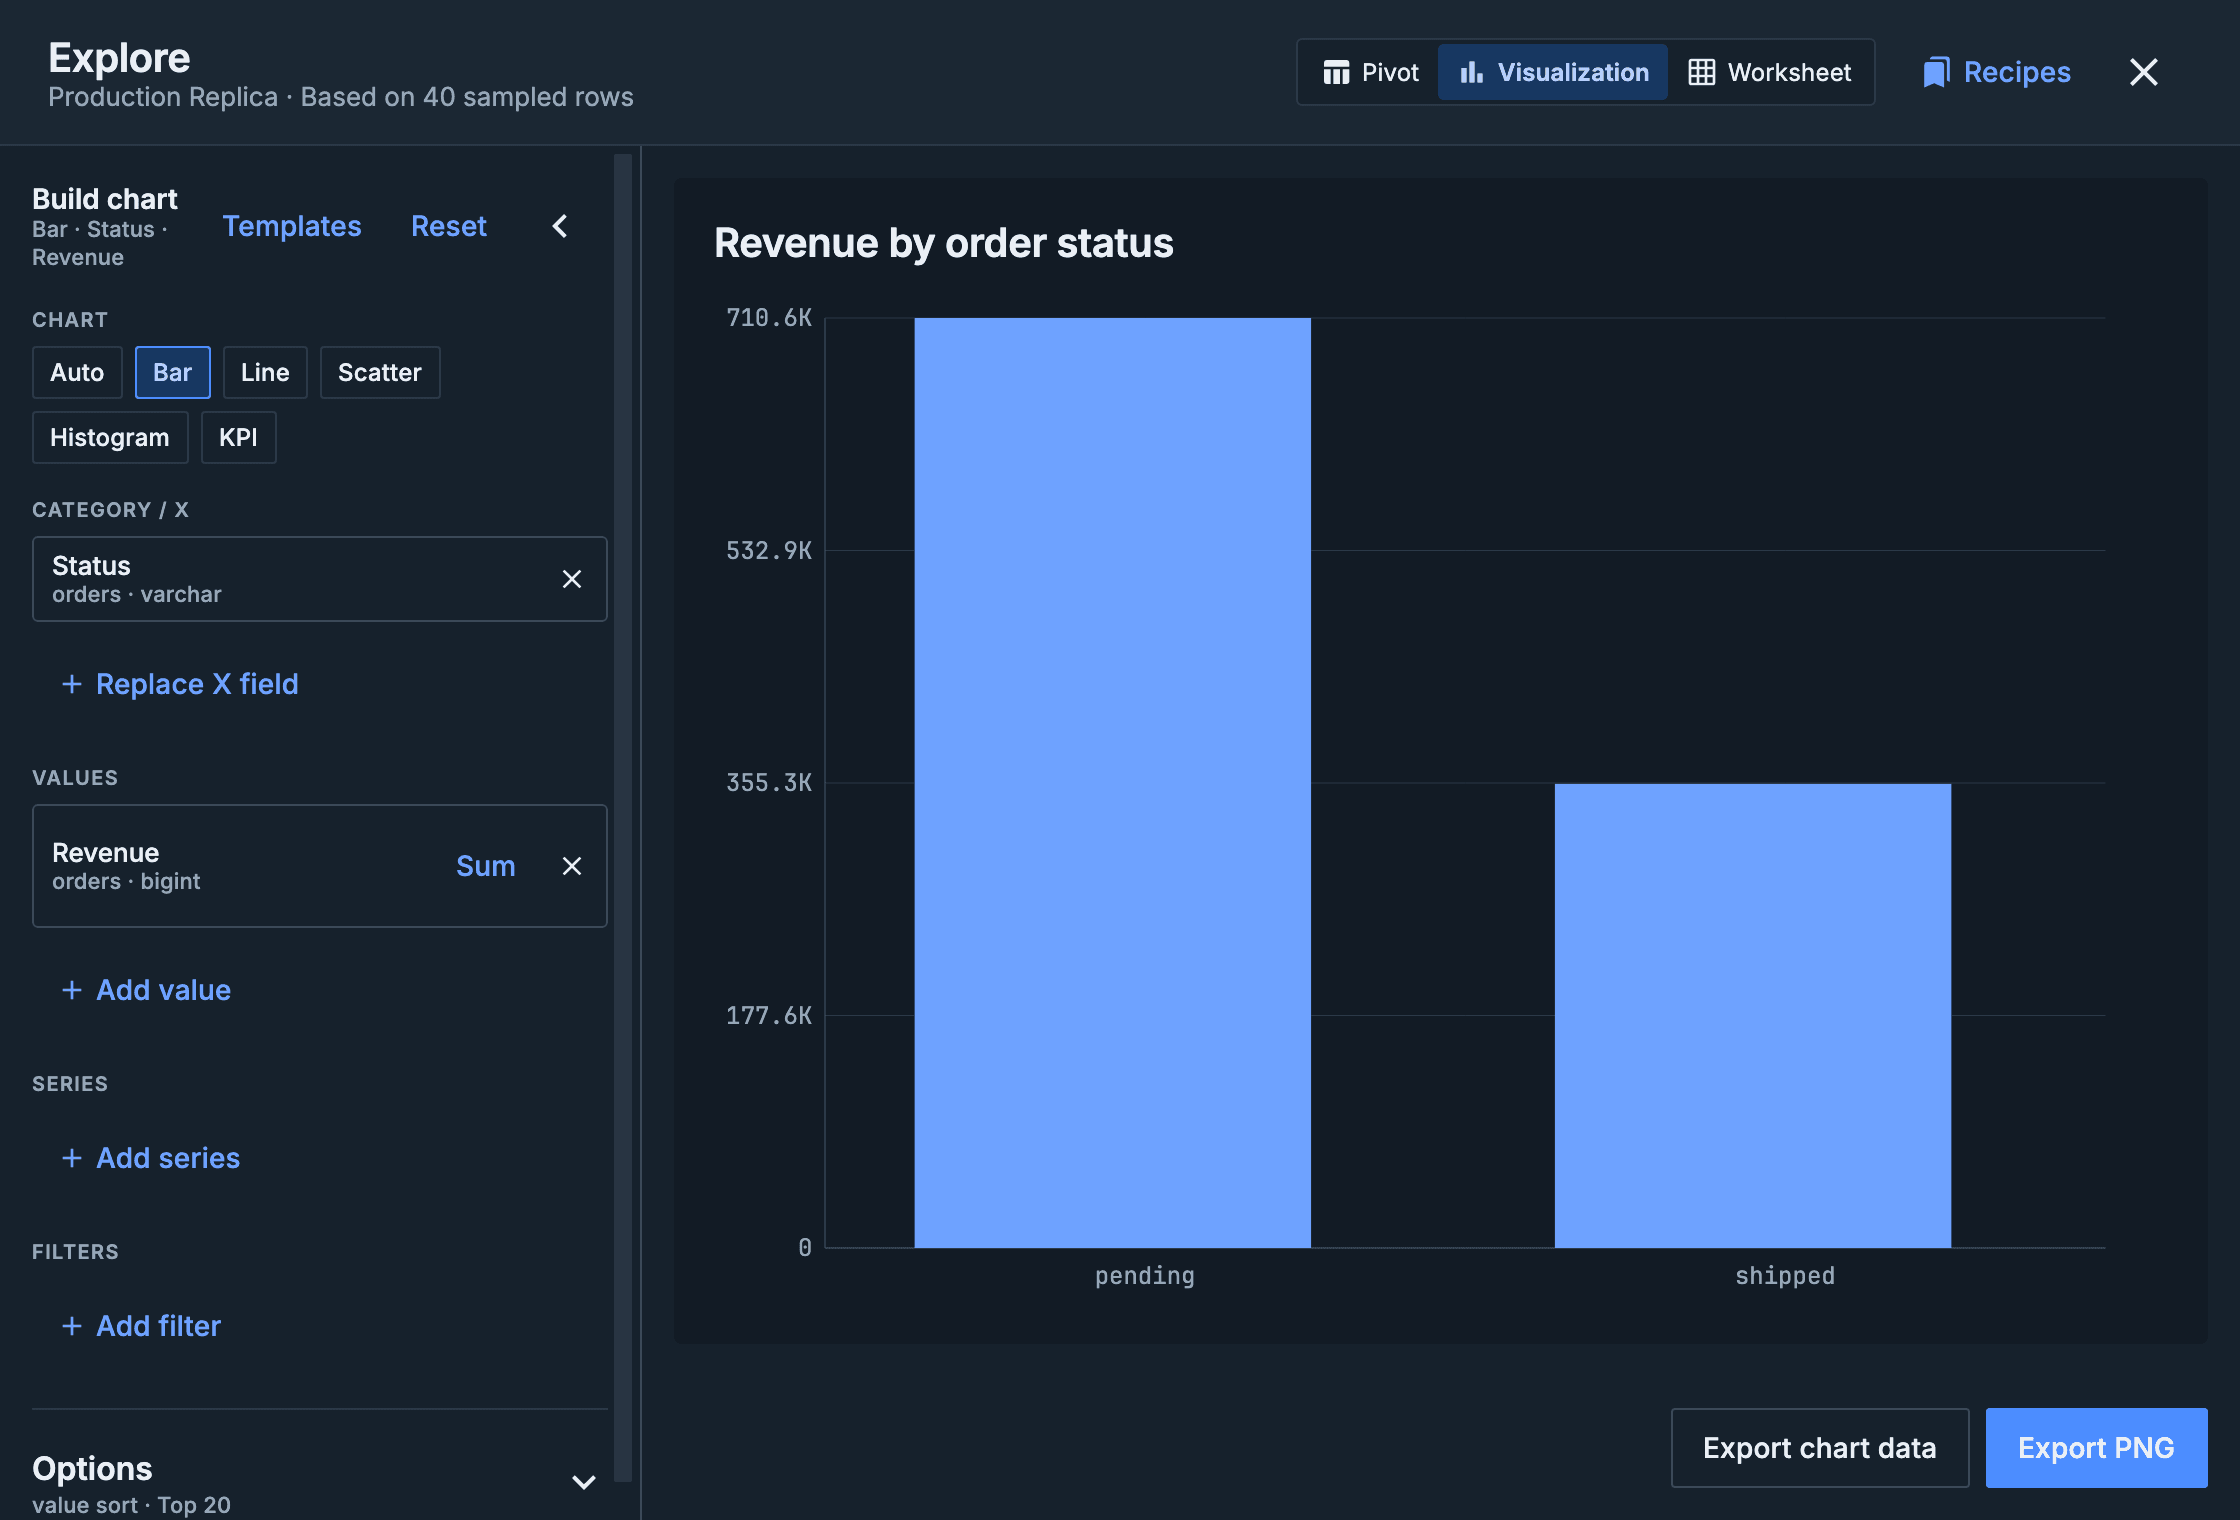
Reporting, reimagined
Most exported reports are a screenshot with ambitions. Export HTML writes the whole exploration into a single self-contained file: tables sort and filter, the
chart renders inline, and clicking a mark drills into the same source rows the app would show.
Whoever opens it gets the interactivity without a database connection, credentials, or a live
query to re-run. CSV and PNG exports are still there, for the traditionalists.
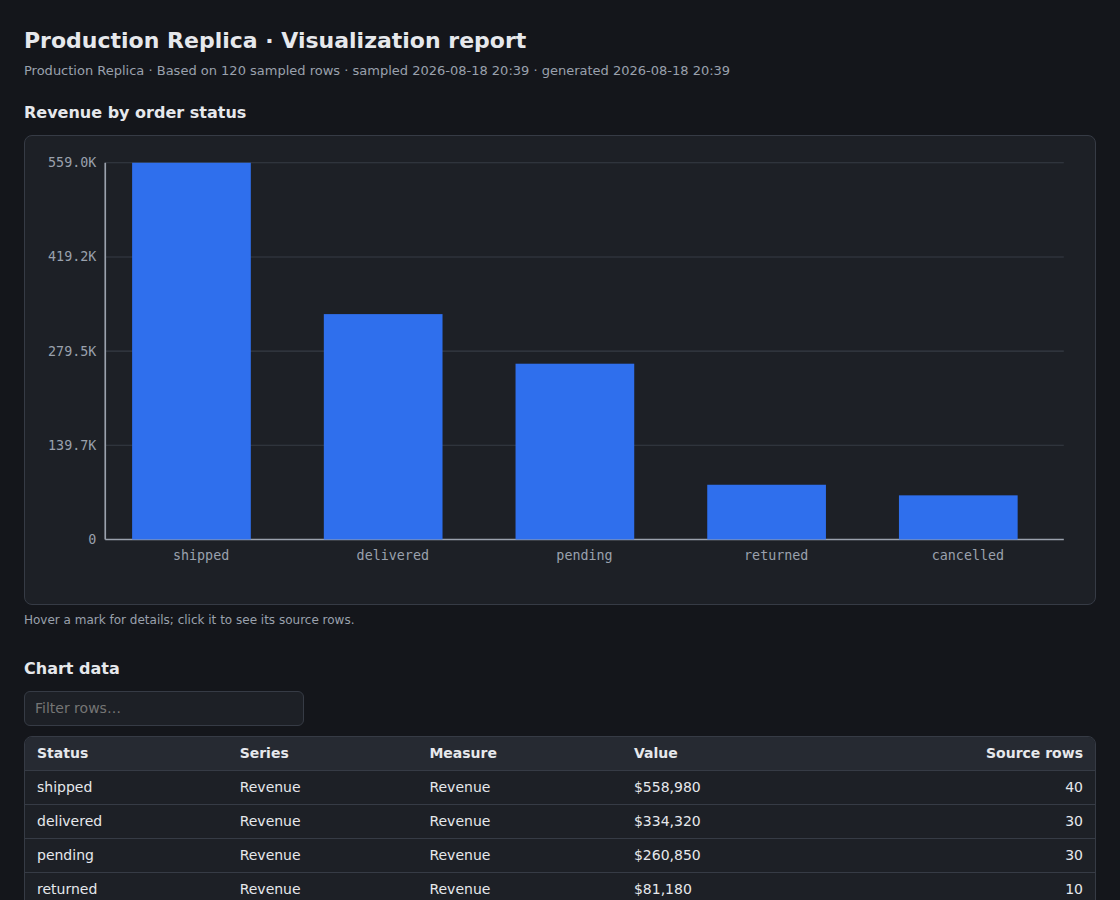
The recording is the actual exported file, opened in a browser. Sort, filter, and drill into the rows; no app, no connection, no setup.
Credentials stay in the keychain
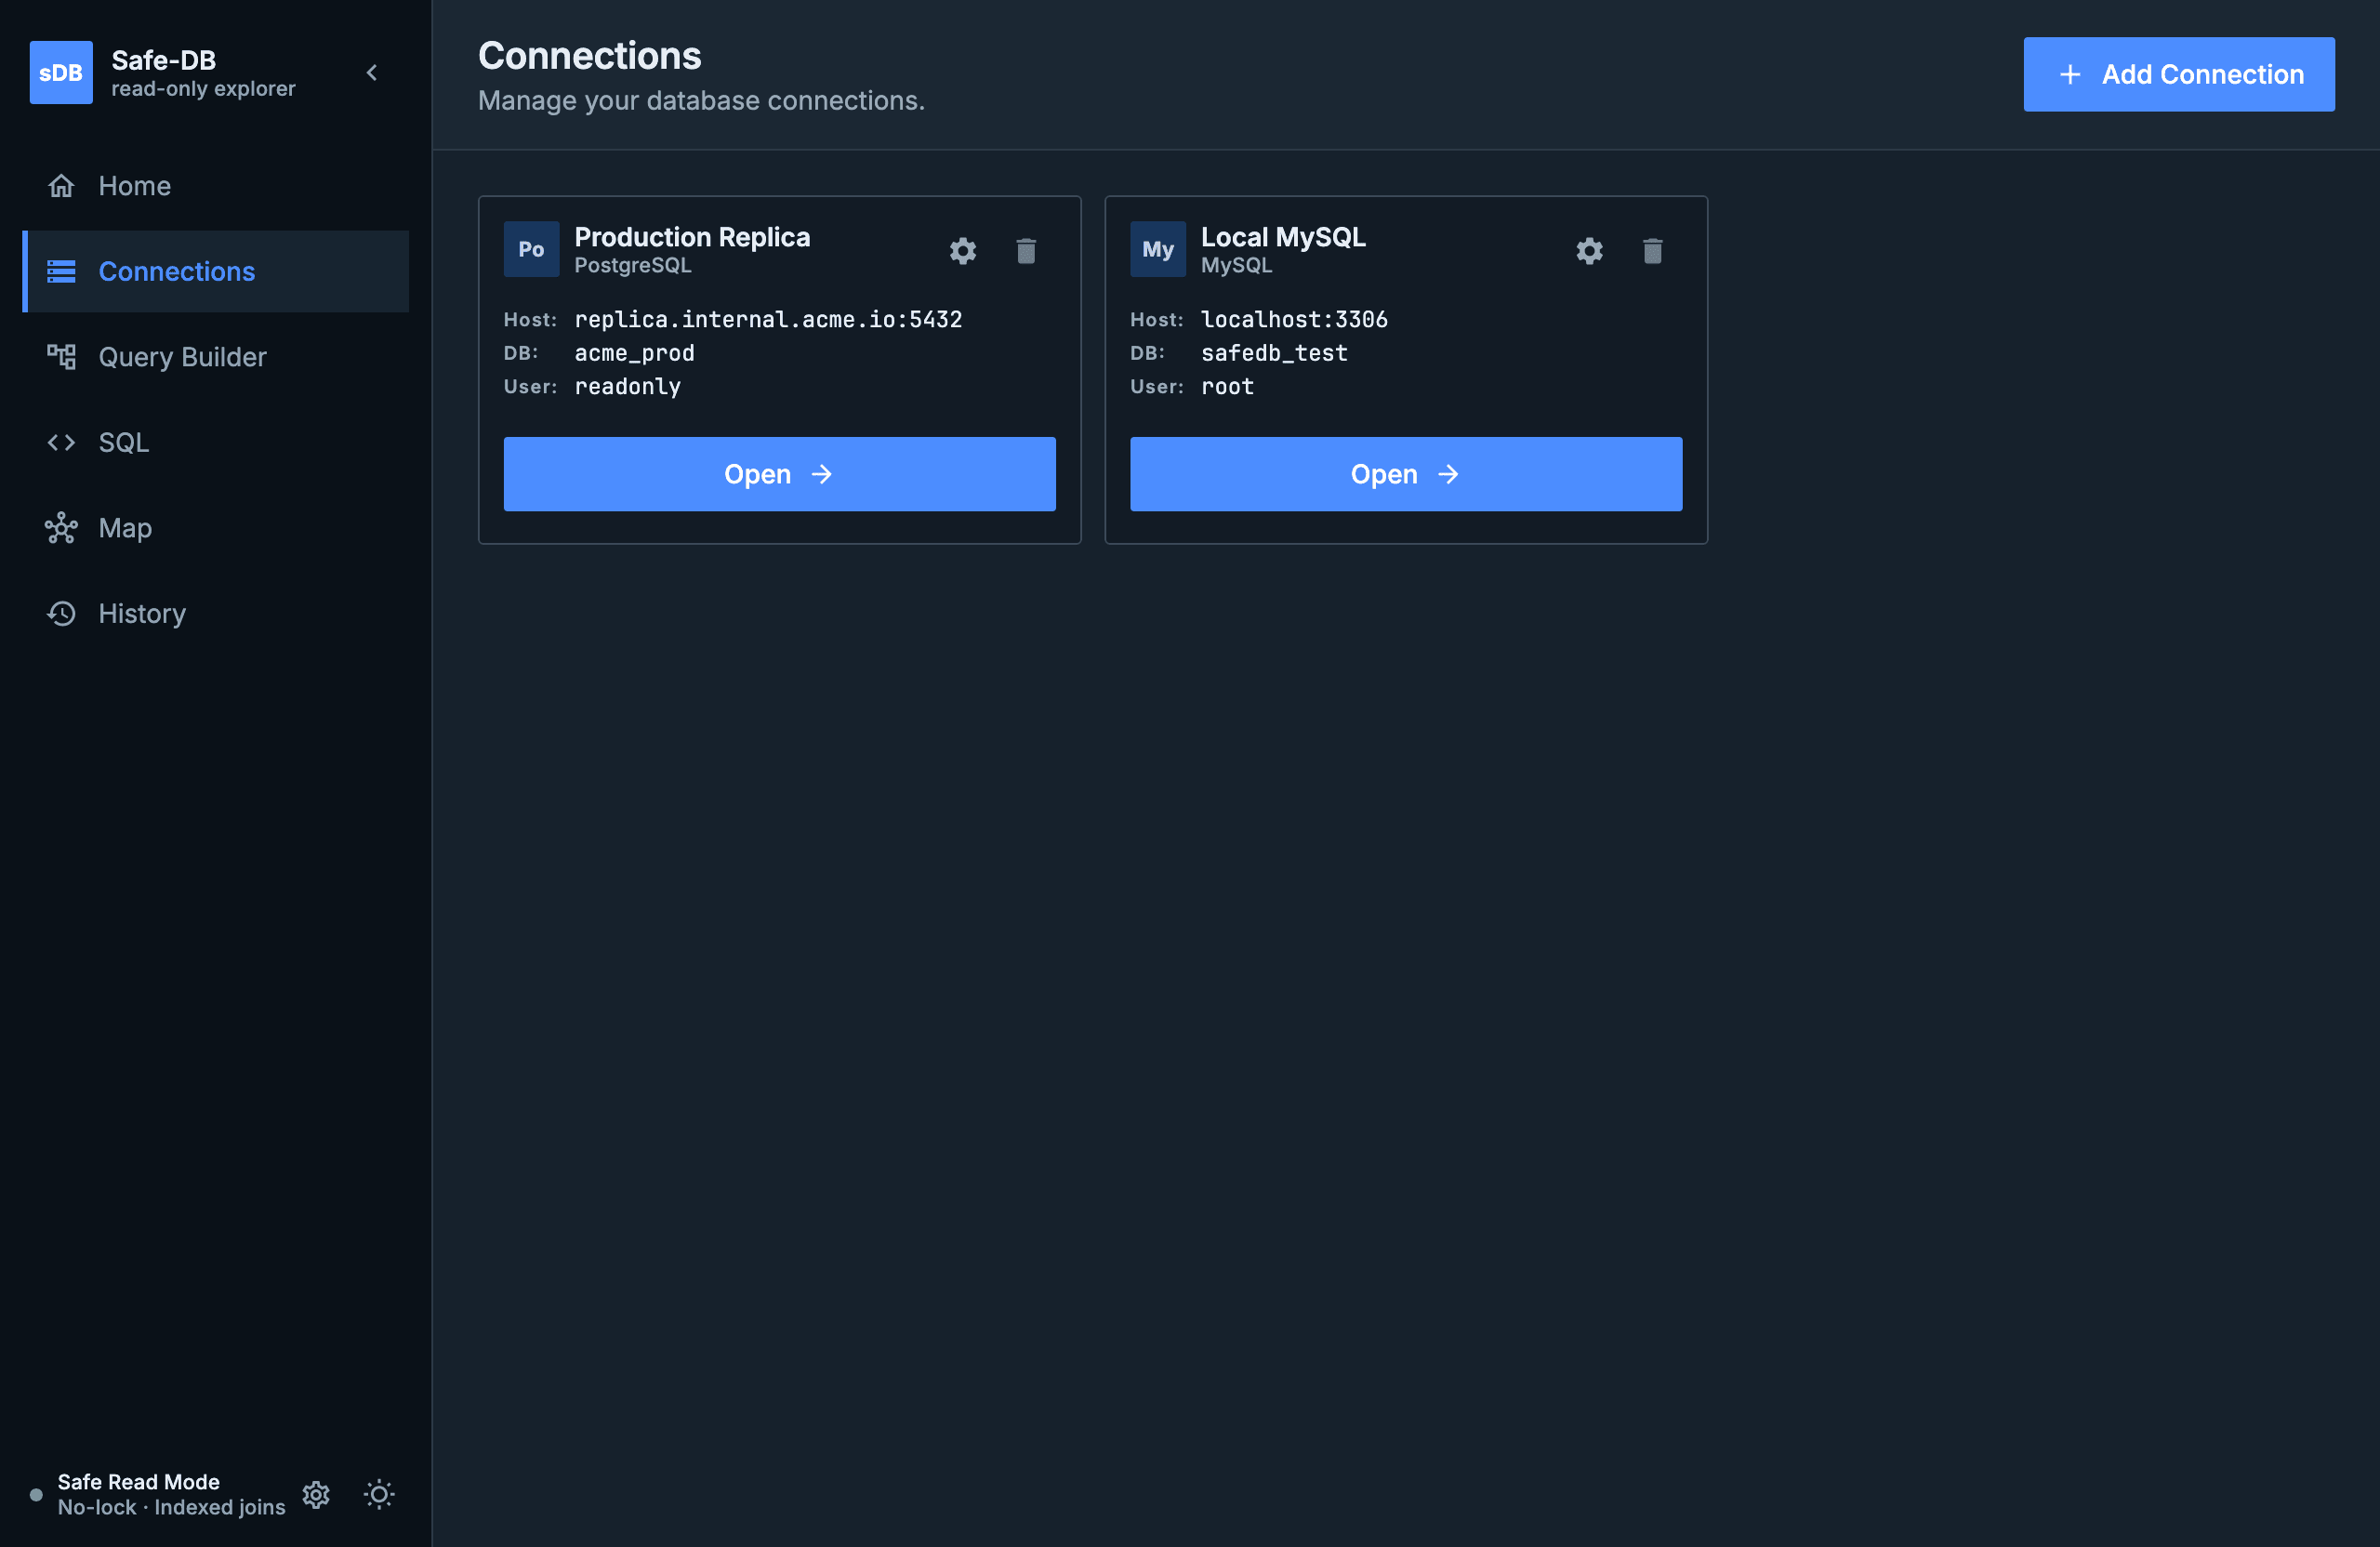
Named connection profiles are saved without passwords. The OS credential store (Keychain on macOS, Credential Manager on Windows) holds secrets when it’s available. Sticky notes are not a backend.
Four engines, one experience
PostgreSQL
Verified TLS with pgjdbc’s normal trust behavior.
MySQL
JVM or launch-profile trust stores.
SQL Server
JVM or launch-profile trust stores.
Oracle
Verified TCPS via an Oracle wallet.
Give them a database client you don’t have to worry about
Signed Windows installer today. The macOS app already runs from source; a signed installer is next. If you’ve ever been paged because someone “just needed a count,” you already understand the product.
Get safe-db